How I debugged and fixed Interaction to Next Paint on my website

If your pages aren't responsive to user interactions, they won't rank well on Google. Google measures this with a metric called Interaction to Next Paint (INP).
The home page of Remote Rocketship had a bad score for INP and for the last 3 months I was struggling to fix it. In this post, I'll go over what exactly INP is, why it was so difficult for me to debug, and how I eventually solved it.
What is INP?
INP measures how quickly users receive visual feedback when interacting with a page (e.g. clicks, touches, keyboard inputs). The below gif from web.dev shows an example:

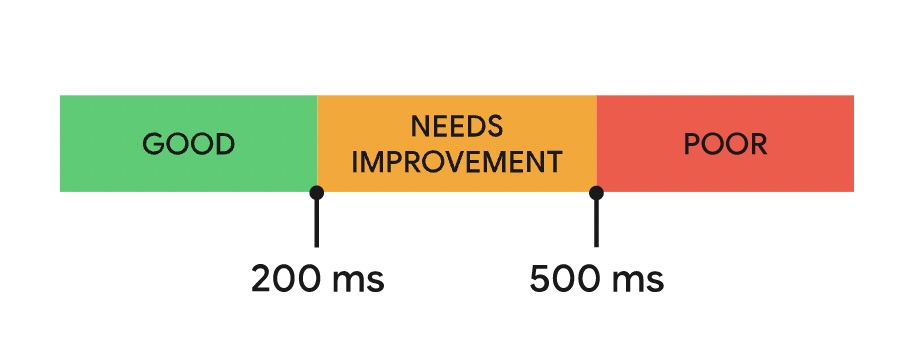
Google defines a good INP time as anything below 200ms. Anything above 200ms needs improvement, and above 500ms is considered poor.
Google measures your score by collecting data on what real users are experiencing using the Chrome User Experience Report (CrUX). This includes data from users all over the world and on different devices. You can view your data on pagespeed.web.dev.
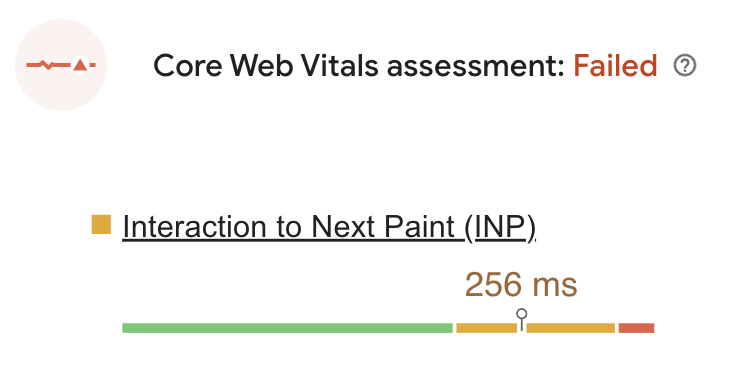
Below is screenshot of what my score was when I first started looking into INP. As you can see, it's above 200ms, and so I fail the core web vitals assessment:

What causes bad INP?
Anything that delays your app to render visual feedback after user interactions affects INP. The usual suspects include:
- Large DOM sizes.
- Main thread blocked or too busy processing other tasks.
- Expensive event callbacks.
- Third-party scripts that schedule many tasks on the main thread.
- Complex CSS selectors that slow down style calculations.
- Unoptimized images and media that consume excessive resources.
The tricky part about INP is that you're probably unlikely to notice delays when using your expensive desktop. However, users on low-end mobile devices are likely to experience them.
Conventional advice for fixing INP
Jacob Groß, a senior performance engineer at Framer, has a great post on how to improve INP in React. The key takeaways are:
- Use concurrent mode features like startTransition and useDeferedvalue to schedule changes as non-urgent and non-blocking
- Mark components as non-urgent by using "selective hydration" i.e. suspense boundaries (or dynamic imports if you're using Next.js)
These changes give your main thread a chance to respond to interactions before rendering non-essential UI changes.
Fixing and waiting 28 days
Everything Jacob described sounded easy. I went ahead and implemented his recommendations to the components I thought were problematic. Then, since INP is calculated from CRuX reports over the last 28 days, I waited a month to see my new score...
Unfortunately, my new score was 256ms. I had only manged to decrease it by 30ms! Not good enough.
Getting better tools for the job
I knew I needed to get serious if I was going to solve this problem. I looked around for tools that could help me monitor INP in real-time and help me debug INP on my website.
The first tool I found was DebugBear. While it's a great product, pricing for starts at a whopping $325 per month. So after my free trial I stopped using it.
Next I tried Vercel's Speed Insights. It has a slick UI and their pricing is more affordable than DebugBear's ($10 per month + $0.65 for 10,000 data points). However, while they identify problematic selectors for you, I still didn't understand why they were problematic. I needed more data.
Eventually I discovered Google's web-vitals library. By adding it to my code, I could log the full information about INP events myself. This includes information such as:
- The component that caused the INP spike.
- The interaction type e.g. click or keyboard input.
- The time the interaction started.
- The load state of the DOM when the interaction occurred.
I captured these logs using PostHog (my analytics tool). The cherry on top was combining these events with PostHog's session replays. This enabled me to view recordings of what exactly people were doing when they faced poor INP 🤯🤯🤯 Now I finally had the full picture!
Below is an example of one such replay:
The problematic component
With my logging and replays enabled, I could finally see what was causing my bad INP. It was the dropdown menu people use to select their job filters:
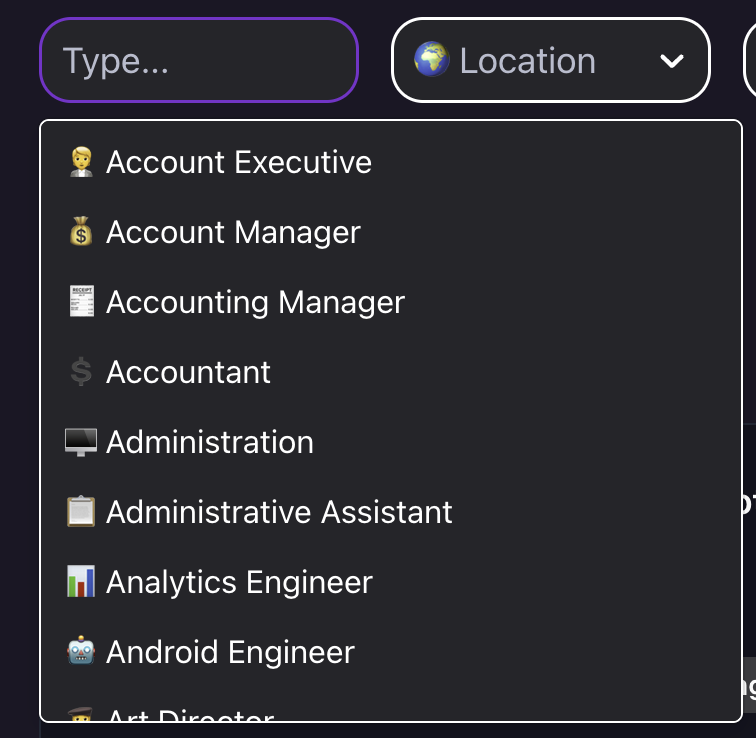
There were two problems I noticed:
- Scrolling the menu was causing a lot of rerenders, and hence an INP spike.
- Opening the menu for the first time was causing an INP spike.
Problem #1: Scrolling the menu
For debugging INP, a post by Uptime Labs recommended to use the React Profiler and enable "highlight updates when components render".
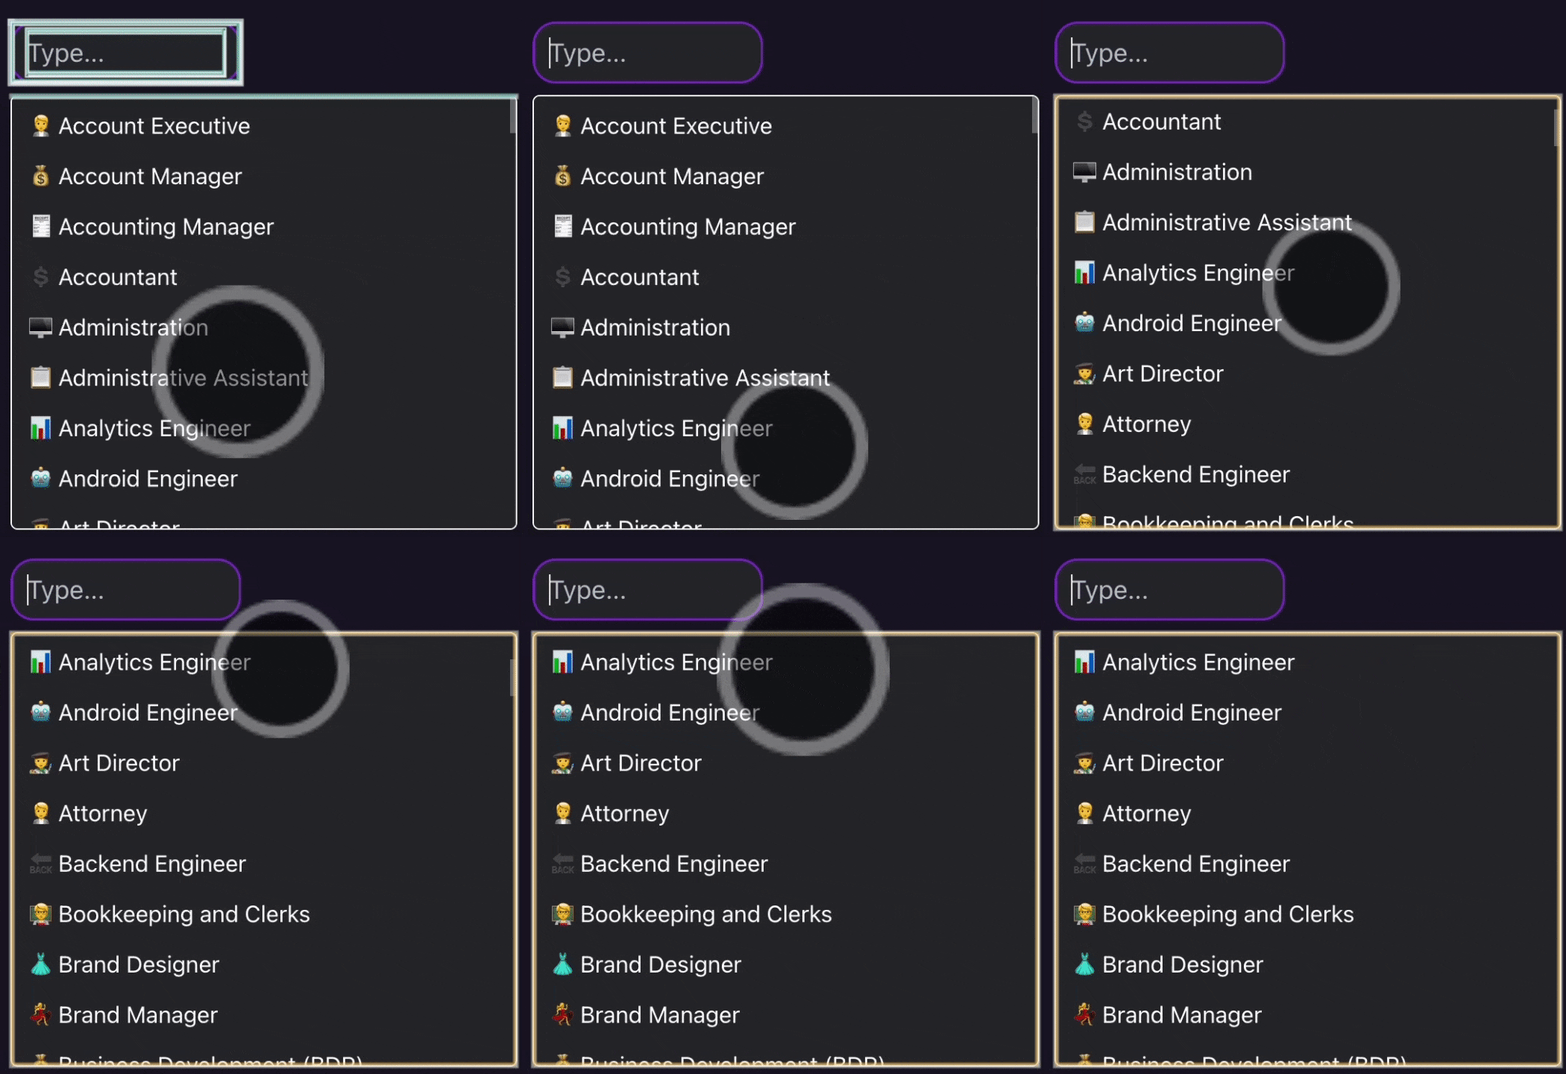
I did so and interacted with my dropwdown. What I noticed is that, for an unknown reason, the menu items were constantly being re-rendered whenever I scrolled the menu:
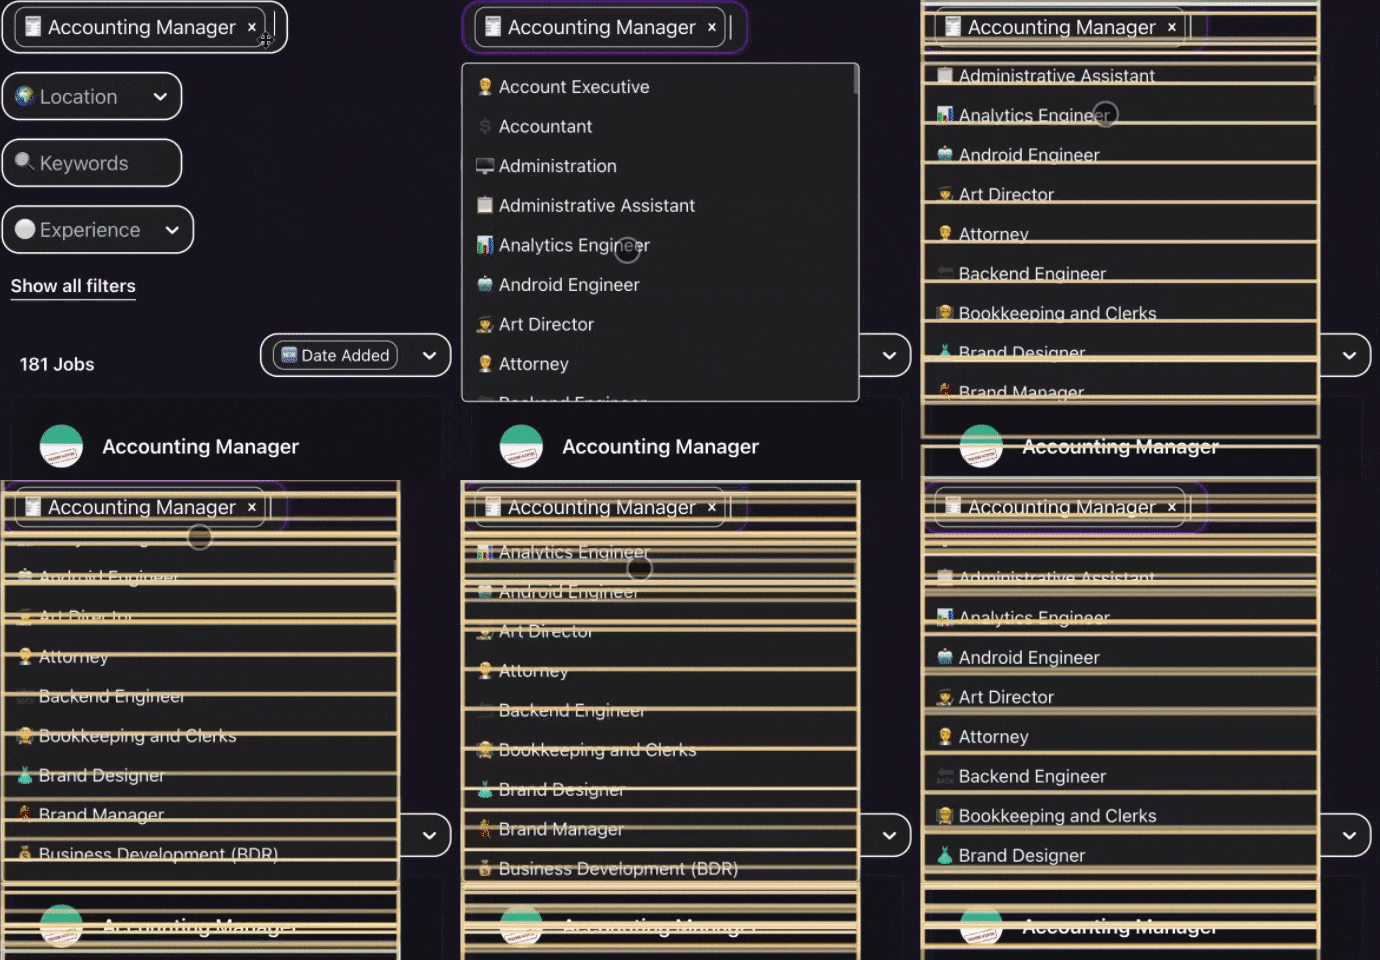
The fix for this was simple: memoize the menu items!
  const MenuItem = memo(({ data, index, style }) => (
    <div style={style}>{data[index]}</div>
  ));
After the fix, I could see it was no longer being re-rendered constantly
Problem #2: Opening the menu
This first fix dropped my INP from 250 to 220ms. It was still not enough but I was making progress!
I looked at my logs again and saw an INP spike when the user opens the menu. My hypothesis was that on low-end devices, the page is trying to open the menu AND the keyboard at the same time. This is probably too much for the device to handle and hence the INP spikes.
Once again, the fix was simple. I used startTransition() to mark opening the menu as non-urgent. This gives the keyboard a chance to load first.
  const menu = memo(({ options, children, maxHeight }) => {
    const [renderedMenu, setRenderedMenu] = useState(null);

    useEffect(() => {
      startTransition(() => {
        setRenderedMenu(
          <List
            itemCount={children.length}
            itemData={children}
          >
            {MenuItem}
          </List>,
        );
      });
    }, [children, height, options.length]);
    return <div>{renderedMenu}</div>;
  });
I shipped it, waited 24 hours to gather results, and held my breath…
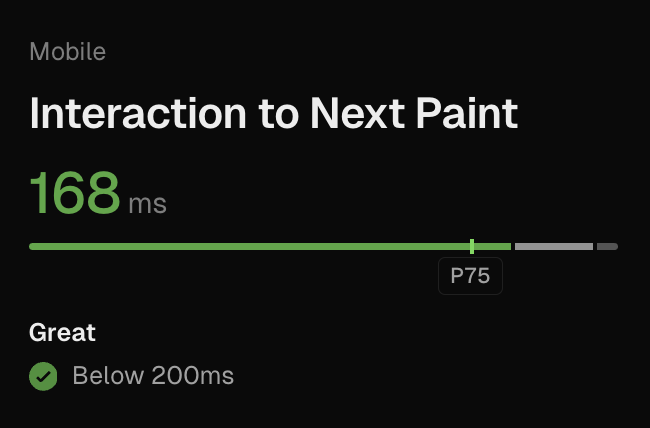
And after 24 hours, I saw my INP finally drop to 168ms! Well below the 200ms required! 🥳
Conclusion
I hope you enjoyed reading my post and that you learned something new. If you're looking for more resources, here are some posts I recommend:
- Optimizing INP for React apps by TK Kinoshita
- Vercel's guide on optimizing core web vitals
- Web.dev's guide on how to optimize INP
